


Report app for Shopify – Simplytick
Management dashboard for your online store
SimplyTick guides you with practical tips, actionable reporting and easy-to-use control panels
Request a Call from Sales
We’d love to talk to you about how Heraldbee can help you grow your business!
Complete the form below to request a call from sales
How to use SimplyTick
Welcome to SimplyTick! To get started with SimplyTick, please take our guided tour.
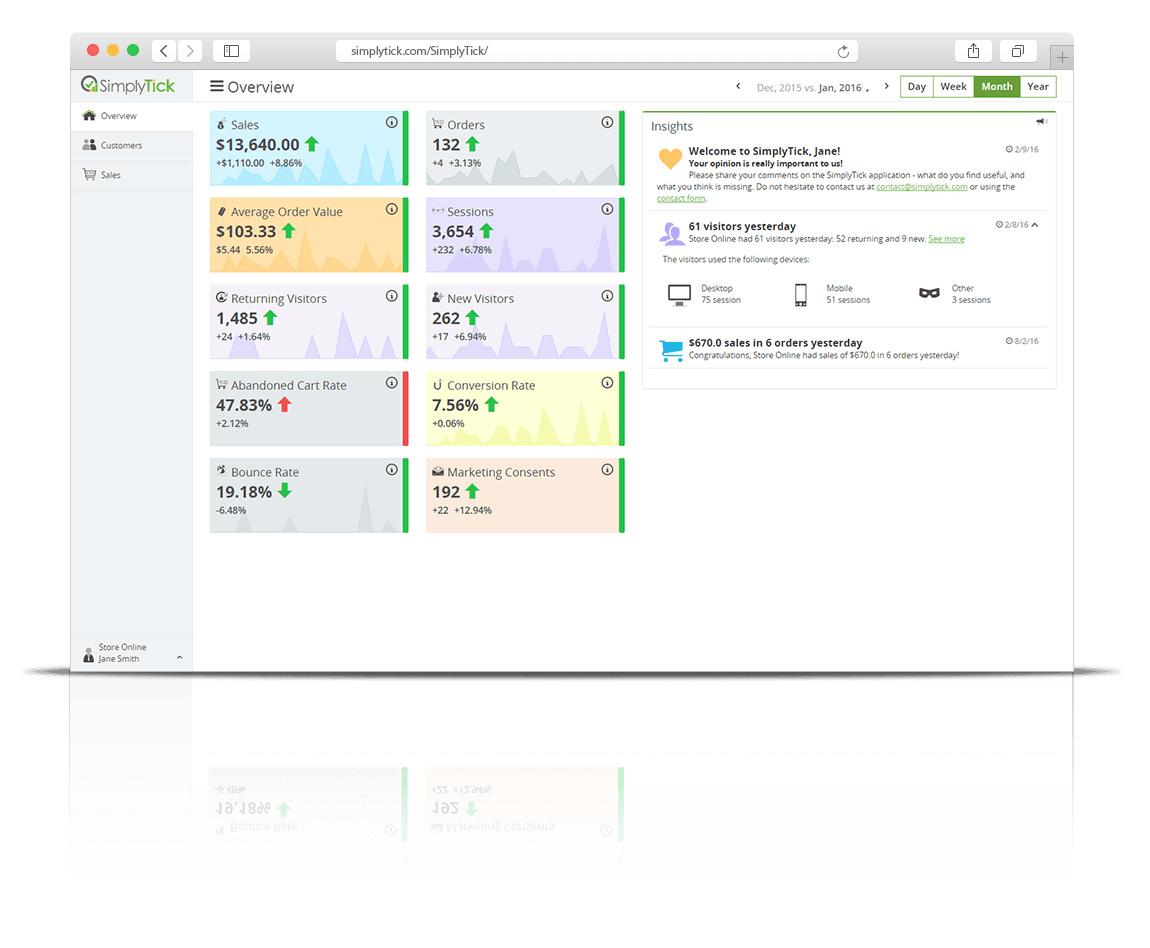
This is the SimplyTick dashboard. The dashboard is where you will find information and statistics based on your sales, orders, and customers.
Dashboards
There are three dashboards:
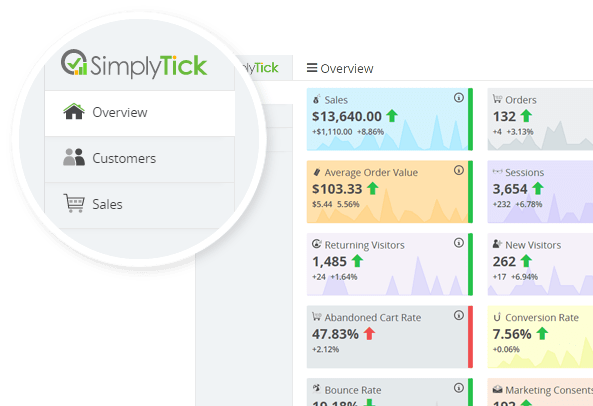
 Overview
The overview dashboard presents basic information about the store.
There are several widgets. Each widget consists of the name of a metric, its value, and changes calculated over the previous time range. If you are not sure what the metric means, just hover over the ![]() icon.
icon.
The Insights panel contains personalized information about your store: how many visitors you have or how many sales you have made, as well as tips on how to improve your business. Here you can also find short messages about updates and changes to the application. Remember to check your insights every day!
 Calendar
The SimplyTick calendar provides you with a variety of options for viewing and comparing your sales data.
By clicking on the calendar icon ![]() you will activate the date picker.
you will activate the date picker.
The main feature of the calendar is the possibility to compare two ranges:
The dates on the top correspond to the calendars on the date picker. Additionally, arrows on the sides of a date string allow you to quickly shift the selected ranges to the next or previous ones.
Checkbox turns off or on the Compared To
calendar. Turning off this checkbox allows you to view your data purely in the Selected time range.
Time Ranges
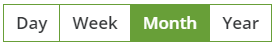
Simply select the time period you’d like to analyze:

Day presents data for selected day. Available only for the Overview dashboard.

Week allows you to view the data from your selected week.

Month presents data for the selected calendar month.

Year displays data for the selected year.
 Customers
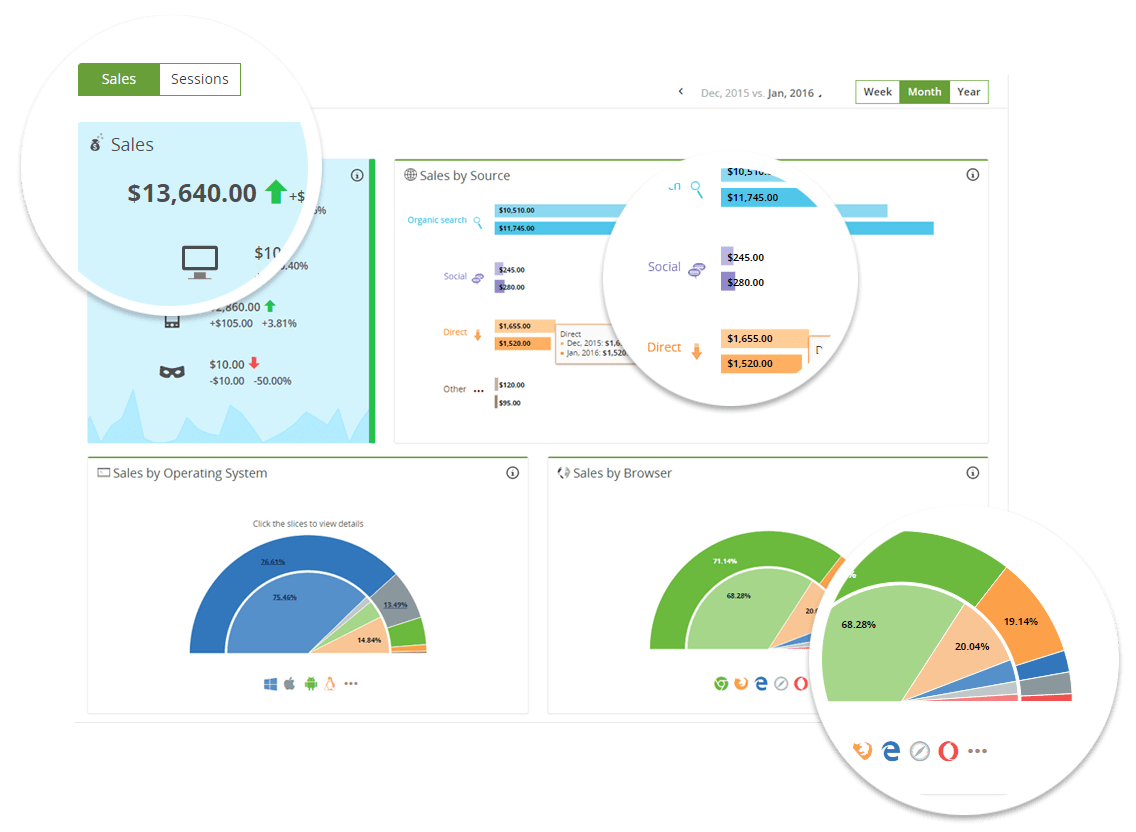
The Customers dashboard presents data about your sales and sessions classified into several categories.
You can select which metric – sales or sessions – you want to see.
The Devices widget shows which device is mostly used by your customers and generates the biggest profit. You can see a total value of the selected metric, and three sub-values for desktop, mobile devices and other sources (like internet bots, video game consoles, etc.).
The Sources bar chart shows you which traffic channels are the most effective. The selected metric (Sales/Sessions) is grouped by traffic channels.
Two semi-circle charts present selected metrics (Sales/Sessions) grouped by operating system or by browser. You can see which operating systems and browsers are the most popular among your customers.
 Sales
Sales
Apart from the widgets, there are two time charts – sales and sessions. You can compare your current number of sessions and sales in a different time period. The Column chart presents data regarding the number of orders, as well as the average order value (presented as a tooltip visible when you hover).
You can also view your sales grouped by the time ranges:
The Week range allows you to view data from each day of the week (from Sunday to Saturday).
The Month range divides data into separate days from 1st to 28th/29th, 30th or 31st depending on the selected calendar month.
Sundays are marked red to help you recognize the beginnings of the weeks.
The Year range presents monthly sums from January to December.
Extra Features
We also provide additional details which you can find on the charts. Don’t miss them!

The color of Compared to range is always dimmed in the charts, so you can distinguish it from the Selected time range.

For every chart there is a tooltip with statistics for the Selected and Compared To ranges.
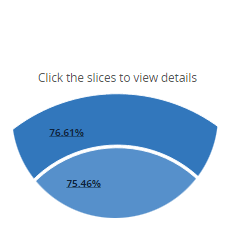
Semi-circle charts sometimes have a drilldown. By clicking on a slice, you can get additional information about the selected part of the chart.
Video
Watch our video!